|
Using Visual Studio |
||||||||||||||||||||||||||||||
Required Setup for 32-bit
Applications
Using Visual Studio: Building and running a 32-bit program
Now you're ready to open and build your first 32-bit
project. Opening a Project
Visual Studio requires assembly language
source files to belong to a project, which is a kind of container. A
project holds configuration information such as the locations of the
assembler, linker, and required libraries. A project has its own folder, and it
holds the names and locations of all files belonging to it. If you have not already done so, download
the author's library zip file containing required MASM library with many
useful procedure. After downloading this file, un-zip it into the root of
your C: drive. It must be place at C:
(i.e. after unzipping you should have a C:\irvine folder and a file
called Irvine32.inc at C:\irvine\Irvine32.inc. If you have not already done so,
download the sample project zip file containing an up-to-date Visual
Studio 2019 project that has been configured for assembly language. After
downloading this file, un-zip it into your C:\irvine directory. It
contains a sample asm test file named AddTwo.asm. Follow these steps: 1. Start Visual Studio. 2. Open our sample Visual Studio
project file by selecting File/Open/Project from the Visual Studio
menu. 3. Navigate to your working folder
where you unzipped our project file, and select the file named Project.sln. 4. Once the project has been opened,
you will see the project name in Visual Studio's Solution Explorer
window. You should also see an assembly language source file in the project
named AddTwo.asm. Double-click the file name to open it in the editor. You should see the following program in the
editor window:
In the future, you can use this file as a
starting point to create new programs by copying it and renaming the copy in
the Solution Explorer window. Build the Program
Now you will build (assemble and link) the
sample program. Select Build Project from the Build menu. In the
Output window for Visual Studio at the bottom of the screen, you should see
messages similar to the following, indicating the build progress: 1>------ Build started: Project: Project, Configuration: Debug Win32 ------1>Assembling AddTwo.asm...1>Project.vcxproj -> ...\Project32_VS2019\Debug\Project.exe========== Build: 1 succeeded, 0 failed, 0 skipped ==========If
you do not see these messages, the project has probably not been modified
since it was last built. No problem--just select Rebuild Project from
the Build menu. Running
the Program
The
easiest way to run your first program is to use the run without debugger menu
option. 1.
Make sure the ASM source code file
is open in the editor window. 2.
Select Start Without Debugging
from the Debug menu. The program should run in a separate DOS Window. Was
your program's EXE file blocked by an Antivirus scanner?
Antivirus scanner software has
improved greatly in recent years, and so have the number of viruses (one
website reports 50,000 at present). Because of this, your computer's
antivirus scanner may report a false positive when you build your program, and refuse to let you run it. There are a few
workarounds: (1) You can add your project's bin/debug folder into an
exclusion list in your antivirus configuration. This is my preferred
approach, and it nearly always works. (2) You can suspend your realtime antivirus scanner software, but this will leave
you open to malware for a short time. If you choose this option, be sure to
temporarily disconnect your computer from the Internet. Running a program from the Command Prompt: When you assembled and linked the project, a file named Project.exe was created inside the project's \Debug folder. This file executes when you run the project. You can execute any EXE by double-clicking its name inside Windows Explorer, but it will often just flash on the screen and disappear. That is because Windows Explorer does not pause the display before closing the command window. On the other hand, you can open a Command prompt window, move to the Debug directory, and run Project.exe by typing "Project" (without the quotes). You will need to do some reading on Windows shell commands if you plan to use the command line. Building
and Running Other Programs
Suppose
you want to run another example program, or possibly create your own program.
You can remove the existing assembly language file from the Solution Explorer
window and insert a new .asm file into the project.
Adding
a File to a Project
An
easy way to add an assembly language source file to an open project is to
drag its filename with the mouse from a Windows Explorer window onto the name
of your project in the Solution Explorer window. The physical file will not
be copied--the project only holds a reference to the file's location. Try
this now: 1. Remove the AddTwo.asm file from
your project. 2. Add a reference to the file
Examples\ch03\AddTwoSum.asm to the project. 3. Build and run the project. Copying
a Source File
One
way to make a copy of an existing source code file is to use Windows Explorer
to copy the file into your project directory. Then, right-click the project
name in Solution Explorer, select Add, select Existing Item, and select the
filename. Optional:
Set the tab index size
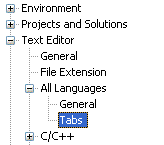
Start Visual Studio and select Options from the Tools
menu. Select and expand the Text Editor item, select All Languages, and
select Tabs. Optionally, you may want to select the Insert spaces radio
button:
I
prefer to set the Tab Size and Indent Size values to 5.
Optional: Syntax highlighting in your source code
When
a text editor uses syntax highlighting, language keywords, strings, and other
elements appear in different colors. Visual Studio highlights MASM reserved
words and strings, as shown in the following example:
This
won't happen automatically, but you can create a syntax definition file named
Usertype.dat that contains MASM keywords. Then when Visual Studio starts, it
reads the syntax file and highlights MASM keywords. If
you decide to use Visual Studio's built-in MASM syntax highlighter, here are
the required steps to set it up: 1)
Download this Usertype.dat
file (enclosed in a ZIP file) given here to a folder in which you have
read/write permissions. Extract it from the zip archive. 2)
Close Visual Studio. 3)
Copy Usertype.dat to the C:\Program Files (x86)\Microsoft
Visual Studio\2019\Community\Common7\IDE folder. Windows
will display a confirmation dialog before copying the file. 4)
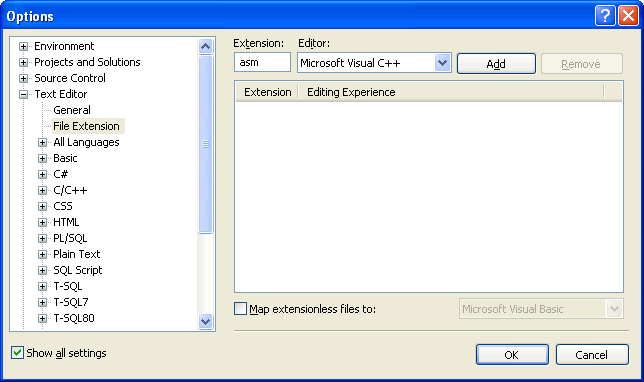
Open Visual Studio, select Options from the Tools menu, select Text
Editor, and select File Extension. On the right side of the dialog
(shown below), enter asm as the extension,
select Microsoft Visual C++ from the Editor list, and click the Add
button. Click the OK button to save your changes.
Open
your project and display an ASM file. You should see syntax highlighting in
the editor. There is a glitch in the highlighting--assembly language comment
line starts start with a semicolon, which C++ doesn't recognize. But this is
a simple workaround: add an extra // right after the semicolon, like this,
which will cause the comments to appear in their usual green color: ;// AddTwo.asm - adds two 32-bit integers.;// Chapter 3 example Run the
Program in Debug Mode
The
easiest way to run your first program is to use the debugger. First, you must
set a breakpoint. When you set a breakpoint in a program, you can use the
debugger to execute the program a full speed (more or less) until it reaches
the breakpoint. At that point, the debugger drops into single-step mode.
Here's how to do it: 3.
Make sure the ASM source code file
is open in the editor window. 4.
Click the mouse along the border
to the left of the mov eax,5 statement. A large red dot should appear
in the margin. 5.
Select Start Debugging from the Debug menu. The
program should run and pause on the line with the breakpoint. (Optionally,
you can close the Diagnostic Tools, Autos, and Call Stack windows.) 6.
Press the F10 key (called Step
Over) to execute the current statement. Continue pressing F10 until the
program is about to execute the invoke statement. 7.
A small black window icon should
appear on either your Windows desktop or status bar. The window should be
blank because this program does not display any output. 8.
Press F10 one more time to end the
program. You
can remove a breakpoint by clicking its dot with the mouse. Take a few
minutes to experiment with the Debug menu commands. Set more breakpoints and
run the program again. Here's
what your program will look like when paused at the breakpoint:
Registers
Soon
you will want to display CPU registers when debugging your programs. Here's
how to make them visible: First, under the Tools >> Options menu,
select Debbuging in the left panel, and select Enable
address-level debugging. Next, set a breakpoint in your source code on an
executable statement, run your program in Debug mode, select Windows
from the Debug menu, and then select Registers from the
drop-down list. If you do not see the Registers
command in the Debug >> Windows drop-down menu (which seems to be the
case for the VS2019 Community Edition, there is a way to add a Registers
command button to your Debug toolbar. Here's how to do it: 1. While not debugging, select Customize
from the Tools menu. 2. Click the Commands tab,
select the Toolbar tab, and select Debug from the list of toolbars. 3. Click the Add Command
button. In the Categories list, select Debug. 4. Select Registers from the list
of commands, click the OK button to close the dialog window. 5. Click the Close button to
close the Customize dialog. You should now see a new button on the Debug
toolbar that looks like a small rectangle containing "0X" when you
begin debugging a program. The
Registers window may appear docked to the top of the workspace, but you may
find it helpful to float the window on top of your workspace. Just grab the
window header with the mouse and pull it to the center area. You will also
want to display the CPU flags. To do that, right click inside the Registers
window and check the word Flags from the popup menu. You
can interrupt a debugging session at any time by selecting Stop Debugging
from the Debug menu. You can do the same by clicking the maroon-colored
square button on the toolbar. To remove a breakpoint from a program, click
its red dot to make it disappear. You
might want to review the author's tutorial: Using the Visual
Studio debugger
The
Book's Example Programs
Assuming Irvine.zip was extract it into the
C:\Irvine folder the folllowing files should appear in the c:\Irvine
directory:
A
subdirectory named Examples will contain all the example programs
shown in the book, source code for the book's 16-, 32-, and 64-bit libraries,
and two sample projects for earlier versions of Visual Studio.
If
You need to install the Visual C++ language
option. First, let's see if it has already been installed (as often happens
in college computer labs).
|


